"I realy laugh at people who consider their science too seriously"
Nasim Taleb
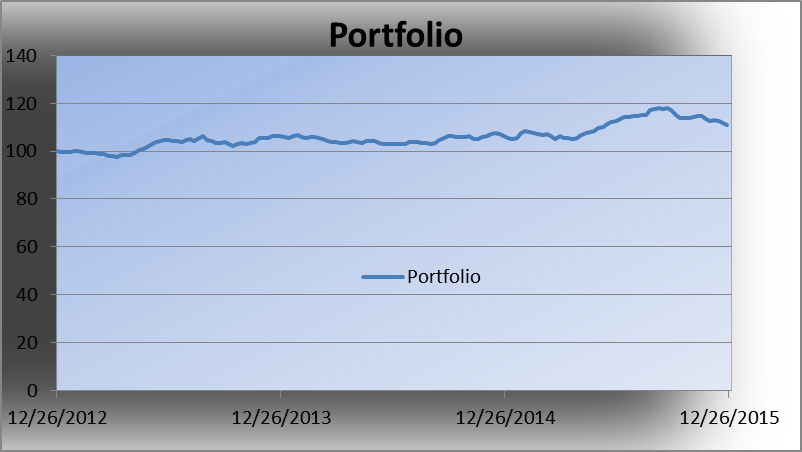
FOREX ASSET ALLOCATION
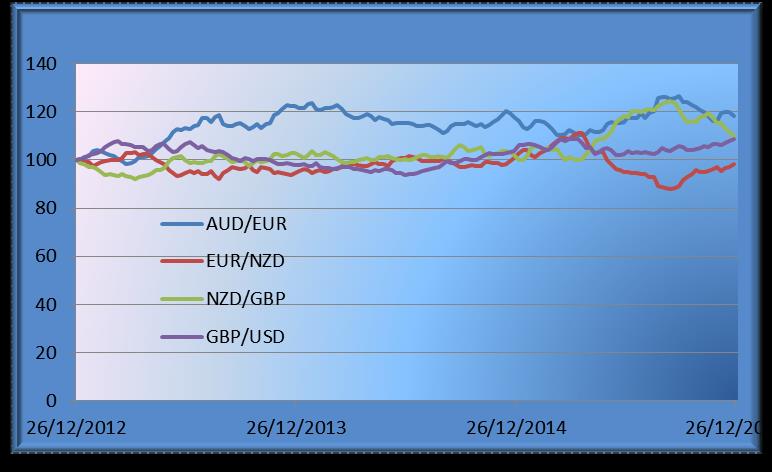
FOREX BASKET
SAMPLE PORTFOLIO AUGUST 13, 2013
| COVAR MATRIX | |||||
| AUD/EUR | EUR/NZD | NZD/GBP | USD/GBP | ||
| AUD/EUR | 0.000025 | 0.000022 | 0.000012 | -0.000001 | |
| EUR/NZD | 0.000022 | 0.000031 | 0.00002 | 0.000001 | |
| NZD/GBP | 0.000012 | 0.00002 | 0.000024 | 0.000000 | |
| USD/GBP | -0.000001 | 0.000002 | 0.000007 | 0.000019 | |
| Mean | Variance | Proportion | RESULTS | |||||
| Port _1 | 0.35% | 0.0013 | % of Port_1 | 20% | Port_1 | AUD/EUR | 26% | |
| Port_ 2 | 0.50% | 0.00% | %of Port_2 | 80% | EUR/NZD | 7% | ||
| Covar | 0.0000096 | Mean | 0.47% | Port_2 | NZD/GBP | 46% | ||
| Variance | 0.01% | GBP/USD | 21% | |||||
| Sigma | 0.32% | 100% |
*Means Matrix(not necessary) --->expected values for each portfolio based on linear regression
between currencies. It was used free spreadsheets (KINGSOFT Free Application).
*It should be considered the carry trade cost. The risk free rate is zero.
* The model needs more to be analyzed.
*The target of the portfolio is to minimise the volatility of our investment (or our exposure ) in currencies.
**It is a BLACK-CAPM model influenced by Prof S. BENNINGA. More details are included in his book
"Financial Modeling".
It was not used no other kind (fundamental, diagram etc.) of analysis.
**DATABASE: University of British Columbia (https://fx.sauder.ubc.ca/data.html)
**SOURCE: CHAOS Analysis (August 2013)
_________________________________________________________________________________________________
Important Notice: Investment in forex & stock markets contains many risks and the investor may lose money.
The webpage is not responsible for any investment loss and does not guarantee all the
sources and databases.
_________________________________________________________________________________________________